Barometers are defined as: "an instrument measuring atmospheric pressure, used especially in forecasting the weather and determining altitude."
In trading you will be swamped, overwhelmed, and even tricked into believing that "this or that" indicator is the best in the land. This simply isn't the case. What we've learned is that no indicator is perfect, and all have limitations (some more than others.)
But we've learned over the years that indicators were created for and only work in certain trading Climates. Fractals, which we use as a Barometer works best in its lane.
CHAOS FRACTAL
As Bill Williams introduced this market indicator he originally named it the "5 Finger Boogie" , as a band member he based on the formation of the hand (middle finger being taller than the other fingers.) So glad he didn't stick with that name!
 Example 1 | 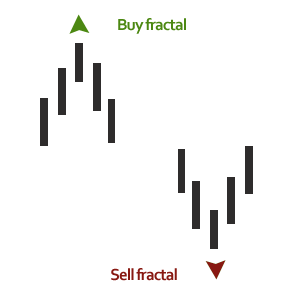 Example 2 |
The Fractals are a versatile tool to say the least, and we will share the many more uses in future posts, however are going to touch on the simple breakout function of it.
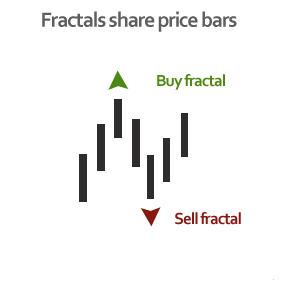
Fractal Formula:
Buy Fractal = High of a 5 candle series
Sell Fractal = Low of a 5 candle series
The key for us is a candle body break and close above or below a fractal to show confirmed pressure.
NOTE: In ranges and tight ones in particular there are many false market signals of upward or downward pressure. However the Stratus Cloud formations will show this.

Example 3
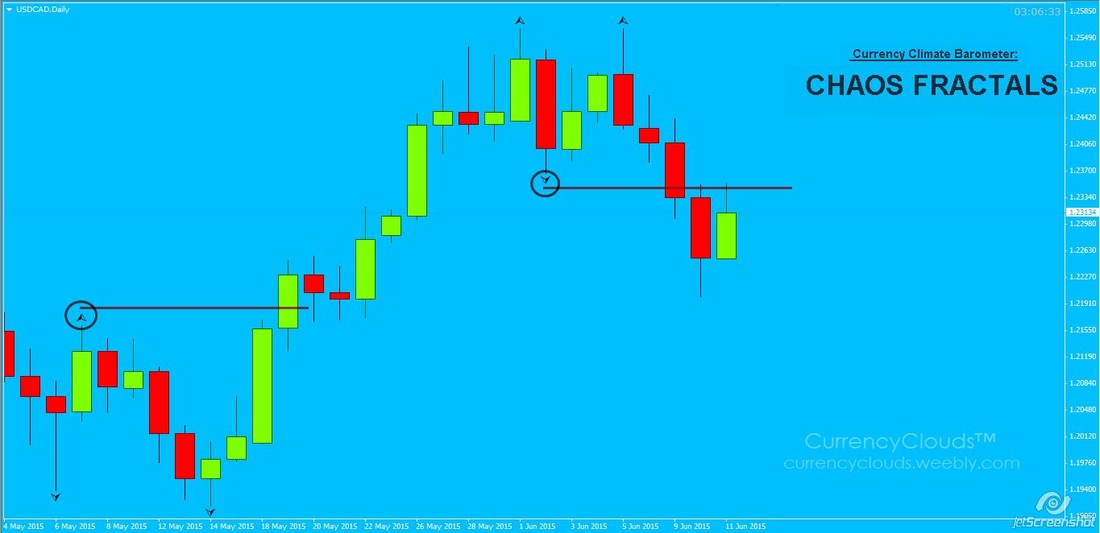
Above is a USD/CAD Daily chart, which shows two Fractal breaks. The first circled Fractal (from left to right) marks a point of price exhaustion to the upside. Price eventually 8 days later breaks the above the Fractal. If you can see the next 3 days never breaks below and continues to move higher.
Taking a look at the 2nd circled Fractal, price exhausts and moves lower forming the fractal eventually it attempts to move higher before ultimately moving lower. As marked price breaks below the marked highlighted Fractal 5 days later. Even day 6 and 7 cannot break higher than that area.
This is how CurrencyClouds™ uses the Fractals; to give an additional insight to upward and downward market pressures.
If you have more questions or more insight leave a comment below.
- Remember, Keep you Head in the Clouds-
 RSS Feed
